Graph Pop-Up Menu
A pop-up menu is available in the Data Settings and Properties to let you access the Measurement Inspector, manage scalar information, as well as to export graphs and execute macros. You should note that the items available in the pop-menu are dependent on the number of items selected — one or multiple.
The following items are available when you select a single graph in the Data Properties and Settings panel.
Current Bounding Box… Automatically creates a box that corresponds to the dimensions of the bounding box of the selected graph.
Current Clip Box… Automatically creates a box that corresponds to the dimensions of the clip box associated with the selected graph
As ORSObject… Lets you save the selected graph in the ORSObject (*.ORSObject extension) file format (see Exporting Objects).
Opens the Measurement Inspector panel (see Evaluating Graphs with the Measurement Inspector).
Opens the Graph Analysis dialog (see Using the Graph Analysis Tool).
Provides a shortcut for selecting macros that can be executed for the selected graph (see Recording and Playing Macros).
Opens the Object Description dialog, in which you can add a description to the selected object or edit its current description (see User Data).
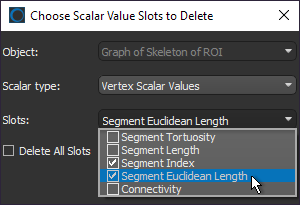
Lets you delete selected measurements. You can select multiple scalar value slots when deleting scalar information, as shown below.
Lets you import edge or vertex scalar values contained in a selected comma-separated values (*.csv extension) file. Scalar values can imported from either an ORS-formatted CSV file, in which case all slots will be imported, or you can import scalar slots one-by-one from a generic CSV file that contains the required IDs and corresponding values (see Importing Scalar Values from a CSV File).
Lets you map vertex scalar values contained within another object (see Mapping Vertex Scalar Values from Another Object).
Lets you add a constant vertex measurement to the selected graph (see Adding a Constant Vertex Measurement).
Lets you add vertex connectivities measurements to the selected graph (see Adding Vertex Connectivities Measurements).
Automatically computes and adds scalar values of distances calculated from the mean position of a series of points.
Note You must first create a points series with the Point tool to enable this item.
Automatically computes the Euler characteristic number that describes the surface of the selected graph.
Creates a region of interest that is representative of the selected graph.
The following items are available whenever you select two or more graphs in the Data Properties and Settings panel.
As Multiple ORSObject… Exports the selected items in the ORS Object (*.ORSObject extension) file format to a selected folder as multiple files (see Exporting Objects). You should note that if the selected objects share the same name, their file names will be appended with a sequential number.
As ORSObject… Exports the selected items to an ORS Object file (*.ORSObject extension) to a selected folder (see Exporting Objects).
Provides a shortcut for selecting macros that can be executed for the number and type of items selected.